Plotting Pandas
Uses matplotlib
https://pandas.pydata.org/docs/user_guide/visualization.html
import numpy as np
import pandas as pd
import matplotlib.pyplot as plt

plt.close("all")

df = pd.read_csv('penguins.csv')
plt.figure()
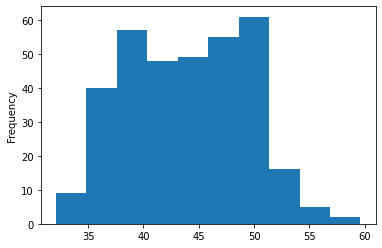
df["bill_length_mm"].plot(kind="hist")
plt.show()

plt.figure()
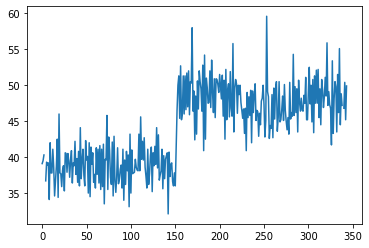
df["bill_length_mm"].plot(kind="line")
plt.show()


species_population = df.groupby("species").size()

index = species_population.index
display(list(index))
display(list(species_population.values))

plt.figure()
# x and height must be lists
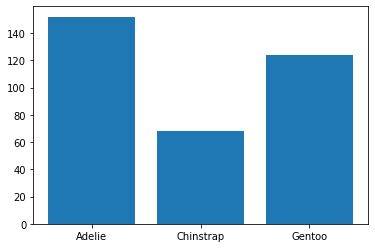
plt.bar(x = species_population.index, height = species_population.values)
plt.show()
['Adelie', 'Chinstrap', 'Gentoo']


[152, 68, 124]

# Scatterplots

species = df.groupby("species")

plt.figure()
plt.xlabel("Bill length (mm)")
plt.ylabel("Body mass (grams)")
for n, grp in species:
    plt.scatter(x = grp['bill_length_mm'], y = grp['body_mass_g'])
plt.show()

# correlation between two columns
df.bill_length_mm.corr(df.body_mass_g)

# correlation matrix
df.corr()
| bill_length_mm | bill_depth_mm | flipper_length_mm | body_mass_g | |
|---|---|---|---|---|
| bill_len_mm | 1.000000 | -0.235053 | 0.656181 | 0.595110 |
| bill_depth_mm | -0.235053 | 1.000000 | -0.583851 | -0.471916 |
| flipper_length_mm | 0.656181 | -0.583851 | 1.000000 | 0.871202 |
| body_mass_g | 0.595110 | -0.471916 | 0.871202 | 1.000000 |
plt.figure()
bill_length = df['bill_length_mm']
plt.hist(bill_length, bins=40)  # default bin #: 10
plt.show()

Last update:
2023-04-24